See where each office is growing, and where it trails the system.
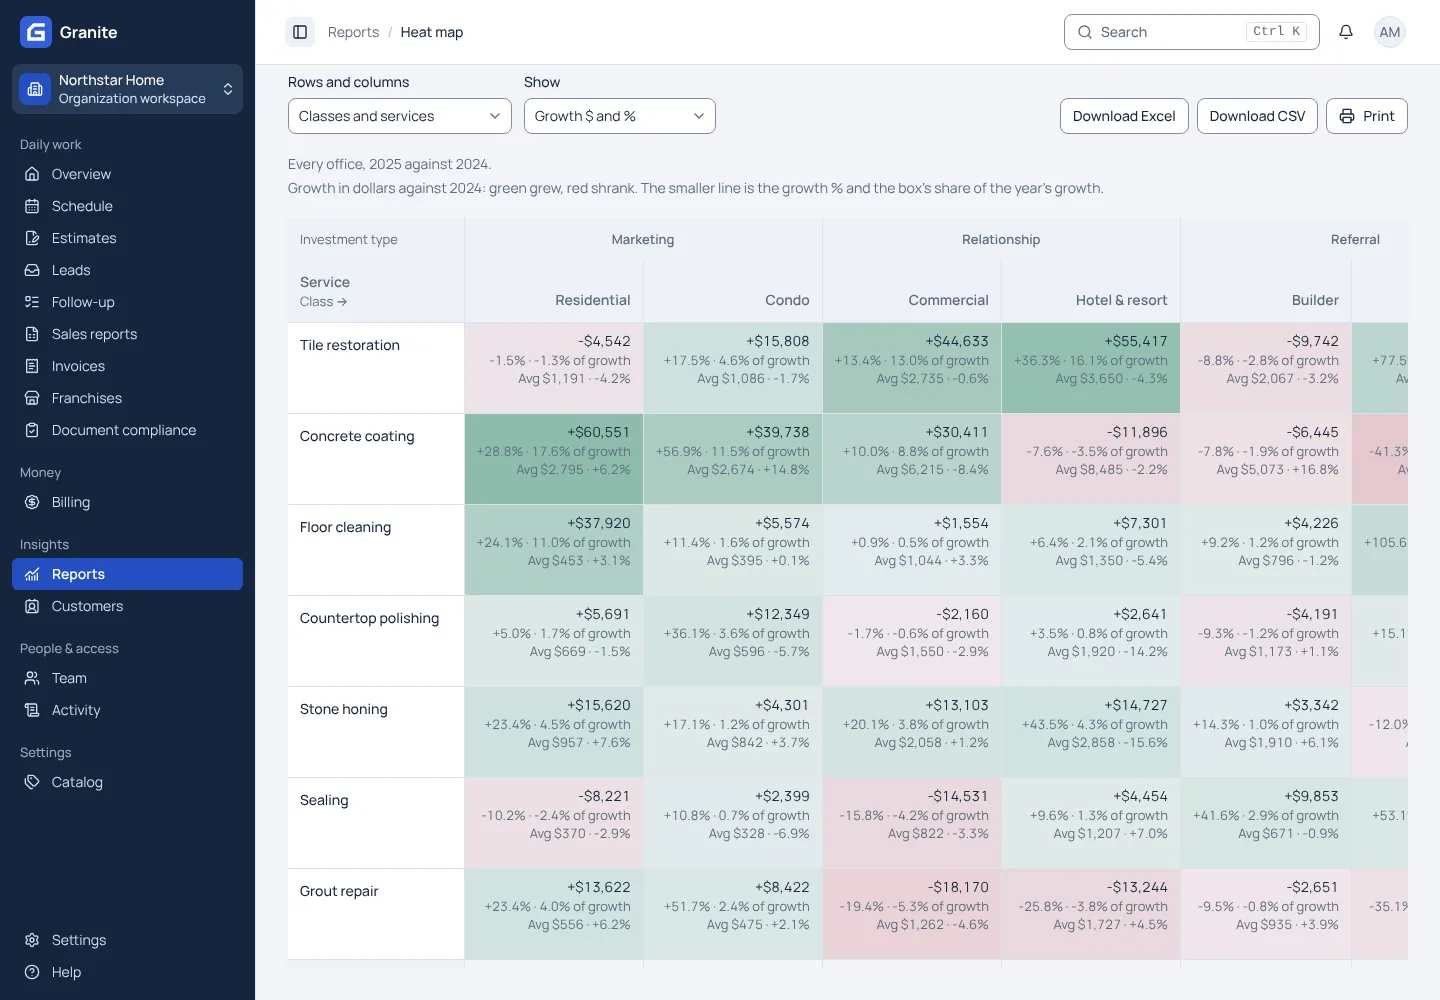
Granite turns every franchise’s sales reports into analysis your team can act on. The heat map lays services against customer classes and shows growth, sales, jobs and average ticket for the whole system or one office, with each office’s growth set against the system’s. Office graphs put an office’s mix of classes, services and investment types beside the system’s, and chart its sales by month against last year, its recent average and the system’s seasonal pattern. Sales trends follow every franchise across the years.
What you get with sales insights
- Growth in dollars and percent, with each box’s share of the whole change, so the services and classes that moved the year stand out.
- Sales with no class or service show as their own boxes and open the coding checks that fix them.
- Group the map by your own master groups or investment types, and download it to Excel.
See your own reporting and royalty cycle in Granite.
Bring a recent sales report and your royalty terms. We will walk through the calculation, the invoice and the payment with you.